
Measuring Security Automation Without Vanity Metrics
Security automation programs are usually justified with a single number: hours saved. A playbook runs 2,000 times a month, each run replaces ten minutes of analyst work, so the program saves more than 300 hours a month.
That number is easy to calculate and hard to trust. It assumes every automated run replaced work an analyst would actually have done, at the same depth. It says nothing about whether the automation made detection or response better. And it tends to grow fastest for the least valuable automations, the high-volume, low-risk tasks, so programs that optimize for it drift toward automating noise.
This piece sets out the measures we find more useful, and how to collect them from data most teams already have.
What automation is supposed to change
Before choosing measures, it helps to be clear about what automation is for in security operations. Most programs aim for some combination of:
- faster response to the alerts that matter, by removing waiting and manual steps
- more consistent handling, so the same alert gets the same treatment at 3 a.m. as at 3 p.m.
- more analyst time on work that needs judgment, by taking repetitive steps off their plate
- better use of existing tools, by connecting systems that currently need a person to move data between them
Each goal implies a different measure. Hours saved, at best, approximates the third.
Measures that reflect those goals
1. Queue time for high-severity alerts
Split mean time to respond into time spent waiting before anyone, or any automation, acts, and time spent under investigation. Enrichment and routing automation should reduce the first number substantially. If it doesn’t, the automation isn’t addressing the real delay.
2. Time to containment for defined scenarios
For a few well-defined scenarios, such as a confirmed compromised account or malware on an endpoint, measure the time from detection to containment. These are the cases where automation should make the most difference, and they’re the ones leadership cares about.
3. Consistency of handling
For a given alert type, how much does handling vary? Measure the share of cases where required steps were completed, such as enrichment, scoping and notification, and compare automated and manual handling. Consistency is often the largest benefit of automation, and it rarely gets reported.
4. Analyst time on investigation versus mechanics
Sample case records or ask analysts to log time for a few weeks, splitting time spent gathering data and moving between tools from time spent analyzing and deciding. The goal is to shift the balance toward analysis. This is more honest than hours saved, because it shows where the time went.
5. Automation reliability
Track how often playbooks fail, time out, or produce results that analysts override. An automation that fails silently 10% of the time can do more harm than having no automation at all, because people stop checking its output.
6. Escalation quality
Of the cases automation closes or downgrades, how many are later reopened or found to be significant? A rising number means automation is suppressing things it shouldn’t.
An illustrative example
The chart below shows what these measures might look like for a team before and after automating enrichment for its three most common high-severity alert types. The figures are illustrative, chosen to show the shape of a typical result rather than reported from a particular organization.
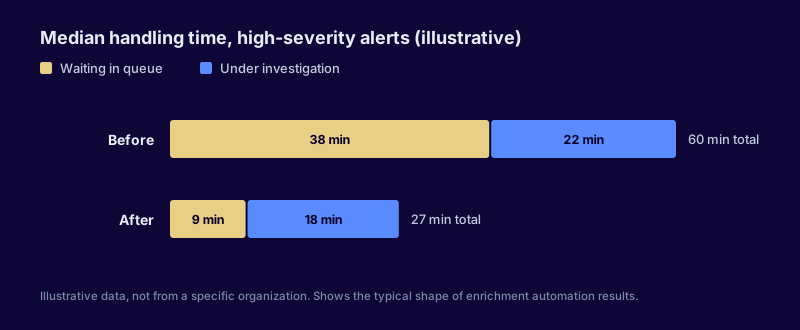
Figure 1. Illustrative data. Most of the improvement comes from queue time rather than investigation time, which is typical of enrichment automation and invisible in a single “time to respond” figure.
Two observations from examples like this are worth noting. First, investigation time changes only modestly. Analysts still need to think. Second, the queue time reduction is where the risk reduction is, because it’s the time an attacker has before anyone looks. Reported as hours saved, the same change would look small. Reported as queue time, it’s a clear improvement in exposure.
Collecting the data
Most of these measures come from data teams already hold:
- case management or ticketing timestamps give queue time, investigation time and time to containment, provided the workflow records state changes reliably
- automation platform logs give run counts, failures and timeouts
- case outcome fields give reopen rates and overrides, if analysts record them consistently
The most common obstacle is inconsistent timestamps: cases where “acknowledged” means different things to different analysts, or states that get skipped. Fixing those definitions is worth doing before any automation project, because without them improvement can’t be shown.
Deciding what to automate next
These measures also help choose the next automation. Good candidates tend to be workflows where:
- queue time is long relative to investigation time
- handling is inconsistent across shifts or analysts
- analysts spend most of their time collecting data from several tools
- the steps are well understood and documented
Poor candidates are workflows where decisions depend heavily on context that isn’t available to the automation, or where a wrong action would be hard to reverse. That doesn’t rule out automating them. It means deciding carefully where a person should stay in the loop, which varies by workflow, by the confidence of the detection and by the organization’s tolerance for disruption.
Reporting to leadership
A short quarterly report covering queue time for high-severity alerts, time to containment for two or three defined scenarios, and automation reliability tells leadership far more than an hours-saved figure. It also builds credibility, because it shows the team measuring what matters even when the numbers are less flattering.