
Turning the 2025 DBIR Into Budget Decisions
Verizon’s 2025 Data Breach Investigations Report, published on April 23, analyzed more than 12,000 confirmed breaches. Every year the report produces a wave of commentary, and every year most of it summarizes the headline numbers. This piece takes a narrower approach. We looked for the findings that should change how a security program spends money in the next planning cycle, and set aside the ones that confirm what most leaders already fund.
Three shifts stand out.
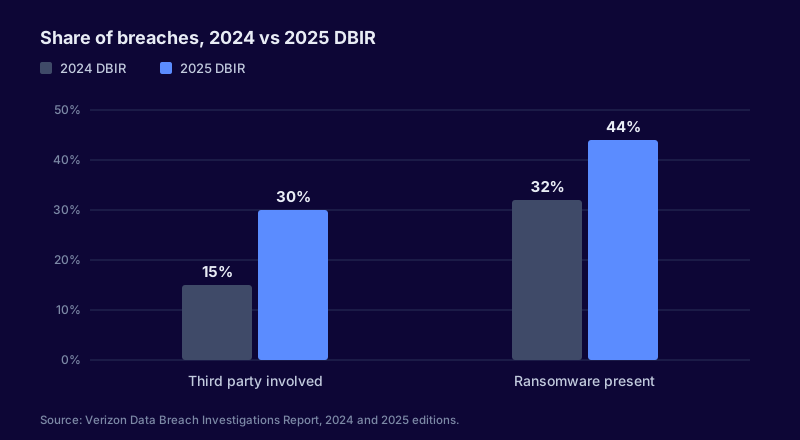
Figure 1. Two shifts from the 2025 DBIR. Source: Verizon 2025 Data Breach Investigations Report, as reported by Verizon.
1. Third-party involvement doubled
The share of breaches involving a third party rose to 30%, from 15% the year before. The report’s definition is broad. It includes breaches that began in a partner’s environment, breaches involving software supply chains, and incidents where credentials or access belonging to a third party were misused.
What it should change: most third-party risk programs spend their effort at onboarding, through questionnaires and document review, and then revisit vendors annually. The breaches behind this number mostly happened during the relationship, through connections, shared credentials and software updates. That argues for moving some budget from assessment toward the connections themselves:
- an inventory of which vendors hold credentials, tokens or network access into your environment
- monitoring of third-party account activity, with the same scrutiny applied to employees
- contract terms that require prompt notification and cooperation during an incident
A question for leadership: which ten vendors could cause the most damage if they were compromised tomorrow, and do we know how they connect to us? If that list takes more than a day to produce, start there.
2. Ransomware is more frequent, and fewer victims pay
Ransomware was present in 44% of breaches, up from 32%. At the same time, the median ransom paid fell to about $115,000, and around 64% of victim organizations didn’t pay at all. The report notes that small and mid-sized organizations account for a larger share of ransomware breaches than large enterprises.
These two trends point the same way. More organizations are refusing to pay, which means more of them are absorbing the full cost of recovery. Recovery capability determines the outcome.
What it should change: if your organization’s ransomware plan still assumes paying is a realistic fallback, it’s time to fund the alternative properly:
- backups that are isolated from the production identity plane, so attackers holding domain admin can’t delete them
- restoration testing at a realistic scale, timed and reported
- a prioritized recovery order that the business has agreed to in advance
Recovery investments are also easier to defend in budget discussions, because their value can be demonstrated in an exercise.
3. Edge devices became a fifth of exploitation targets
Exploitation of vulnerabilities accounted for 20% of initial access, close behind credential abuse at 22%. Within exploitation, edge devices and VPNs made up 22% of targets, up from 3% the year before. The report also found that only about half of edge device vulnerabilities were fully remediated during the year, with a median time to remediate of 32 days.
Thirty-two days is a long time for a device that’s directly reachable from the internet and actively targeted. We covered why these devices are difficult in Edge Devices Became the Front Door in 2024. The DBIR data confirms the pattern held into the year it measured.
What it should change: budget for remediation speed on a small set of assets, rather than volume across all of them. That might mean pre-approved emergency change windows, spare capacity for appliance failover, or replacing end-of-life devices that can’t be patched quickly. It’s a modest line item next to the cost of an incident that starts at the edge.
What didn’t change, and why that matters too
The human element remained involved in roughly 60% of breaches, much as in earlier years. Credential abuse stayed the most common initial access vector. These numbers are stable, so they rarely make headlines, but they’re the reason phishing-resistant authentication and identity security belong in every budget. Funding them means continuing work that’s already paying off.
A one-page summary for your planning cycle
| Finding | Budget implication | Measure to report |
|---|---|---|
| Third-party involvement at 30% | Shift effort from questionnaires to monitoring vendor access | Count of vendors with standing access, and share monitored |
| Ransomware in 44% of breaches; most victims don’t pay | Fund isolated backups and timed restoration exercises | Time to restore a critical system, measured in an exercise |
| Edge devices 22% of exploitation targets; 32-day median fix | Fund emergency change capacity and edge device replacement | Time from exploitation notice to mitigation for internet-facing devices |
| Credential abuse still the top vector | Continue phishing-resistant MFA rollout | Share of privileged and remote access covered |
Each row ties a public data point to a specific spending decision and a measure leadership can follow. That’s usually more persuasive than presenting the report’s headlines.
Using industry data responsibly
The DBIR describes breaches across many organizations, and its sample reflects its contributors. It’s a strong indicator of direction, but it can’t tell any one organization its own likelihood of a particular incident. The most useful way to apply it is the way we have here: as evidence that a trend is real, combined with your own understanding of your assets, controls and threats to decide what it means for you.